According to Charles Darwin’s famous theory of evolution, only those survive who adapt to their changing surroundings. In the current digital sphere, most businesses, as well as consumers, have evolved and taken up online channels to interact, which did not exist a few years ago. Those who have not adapted to these online channels have either faded away in history or are on the way to become redundant.
The fact of the matter is that digital marketing has become a necessity for all online businesses today. And with every passing year, it is bringing new paradigms of marketing. Like any past year, 2017 has brought with it a range of digital marketing trends that have changed how businesses reach out to customers in the virtual world.
Let’s dig deeper into the matter & see how the digital marketing landscape has changed in last one year and what to expect in near future.
The fall of Organic Search
Organic search is still the single biggest source of traffic for many big brands as well as an array of online businesses. However, it is facing a stiff competition from paid searches and social media.
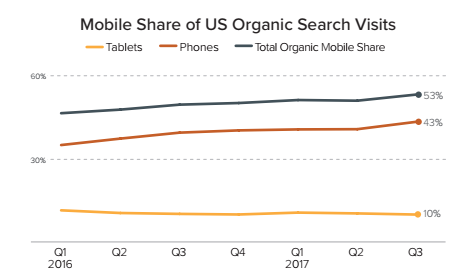
Organic search visits has fallen by almost 3% in last one year and the total share of organic search visits slipped to 26% in Q3 of 2017. Although, there is a 9% rise in mobile search visits, but desktop searches fell 10%. This implies that mobile search is on the rise and people are using search more over smartphones. Out of the total organic search visits during Q3 2017, mobile devices produced 54% visits.
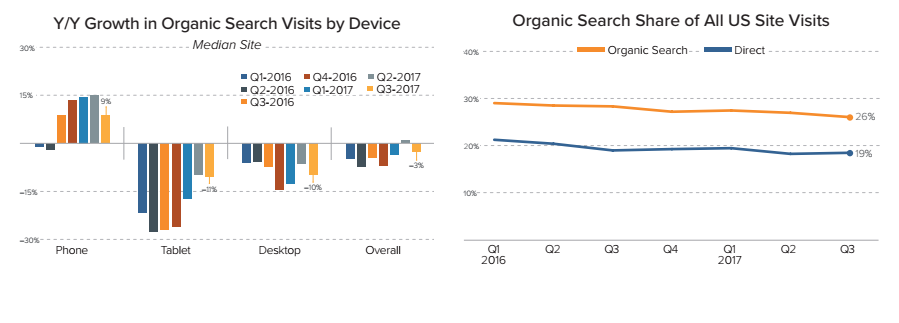
As shown in the graph above, the organic search produced 26% of all site visits in Q3 2017. Interestingly direct site visit traffic share graph was very similar to that of organic search visit share. While many will be concerned that organic search is on a decline, one big reason behind it is that more and more people are searching on smartphones. The overall mobile share of organic search results saw an increase with smartphones producing 43% of the organic search visits in Q3 2017.
CTR of Top Search Engine Ads
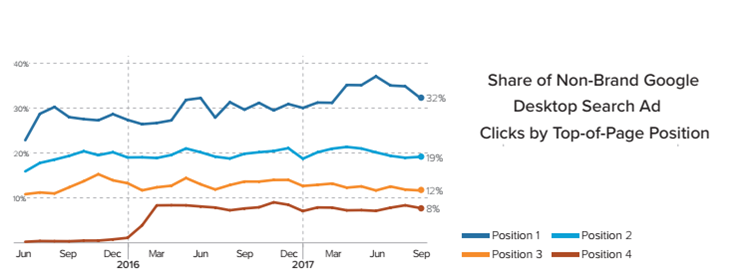
Text ads appearing in position one has constantly generated 30%+ non-brand keyword clicks since May 2017 when Google made a change to its Ad Rank calculation. While there has been a lot of fluctuation in the position one, it seems position two and three have seen steady traction overall.
The Rise of Social Media
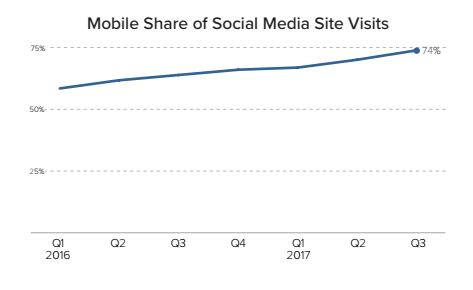
In recent years, there is lot that has been said about the impact of social media in brining traffic to websites. With social media’s constantly swelling role in digital marketing ecosystem, it has been seen that ad spending on social media platforms like Facebook are increasing 40% YOY. The newsfeed of Facebook has one of the highest click-through-rates with brands running direct response focused campaigns.
Social media platforms produced 4% of all website visits in Q3 2017, while mobile devices accounted for three-fourths of these visits.
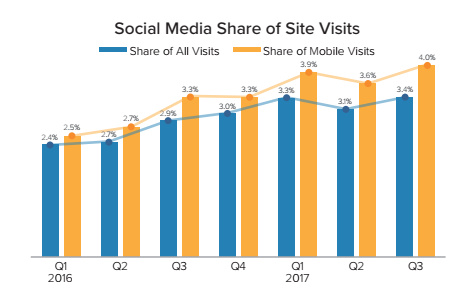
The graph above clearly highlights the rising importance of social media for marketers and how it is crucial for online businesses to have a social media presence. The rules of digital engagement are changing requiring online business to change their strategies.
Want to enhance your brand’s social media presence?
Social media audience size (sector-wise)
Each and every sector has a defined audience and on social media, and it is essential for businesses to take this aspect into account. For example, if your audience is primarily located on Facebook and Instagram, there is no point in spending resources on Twitter marketing.
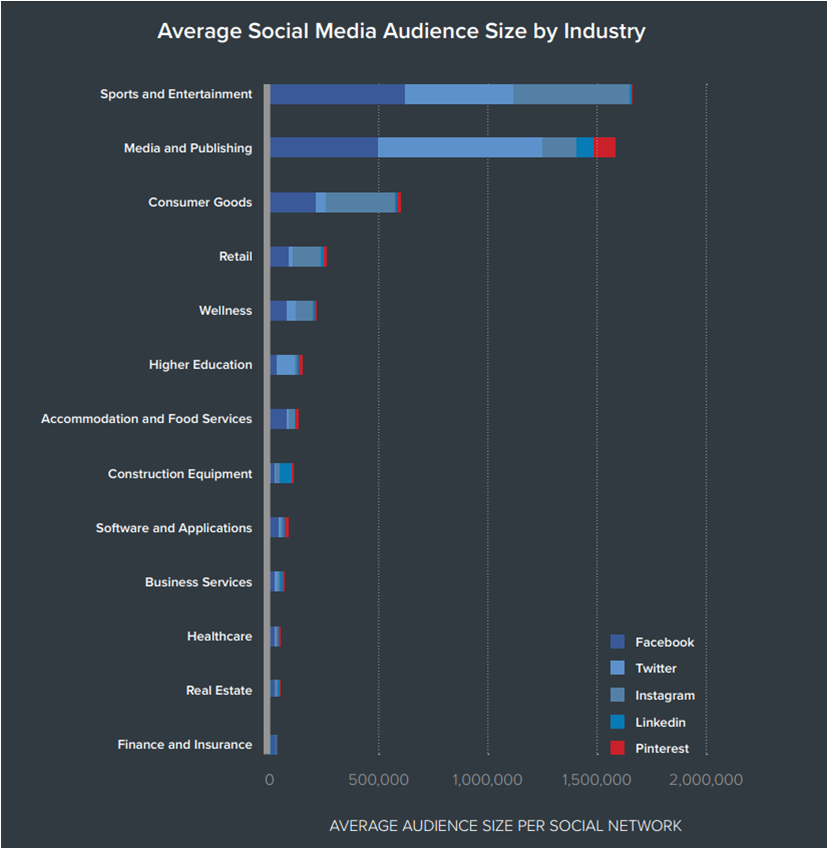
When it comes to social media, sports and entertainment sector has the biggest online audience. The audience for this sector is almost equally divided across Facebook, Twitter, and Instagram. The second position is held by media and publishing sector with Twitter being its most popular platform for the audience. Facebook, Instagram, and Pinterest come at a distant second, third and fourth position, respectively.
Interestingly, consumer goods sector has also seen formidable online presence when it comes to audience, with the bulk of the users on Instagram. This sector has very little traction on Twitter while the rest of the audience is visible on Facebook. The same scenario is visible is retail sector as well, although the audience size is relatively smaller.
Social media engagement ratio (sector-wise)
Although social media audience is a vital aspect to be kept in mind, it is the social media engagement ratio that highlights how well you connect with your audience. For example – you might have 1000 followers on a social media platform, but if you are not engaging with them then the whole purpose of having social media presence defeats itself.
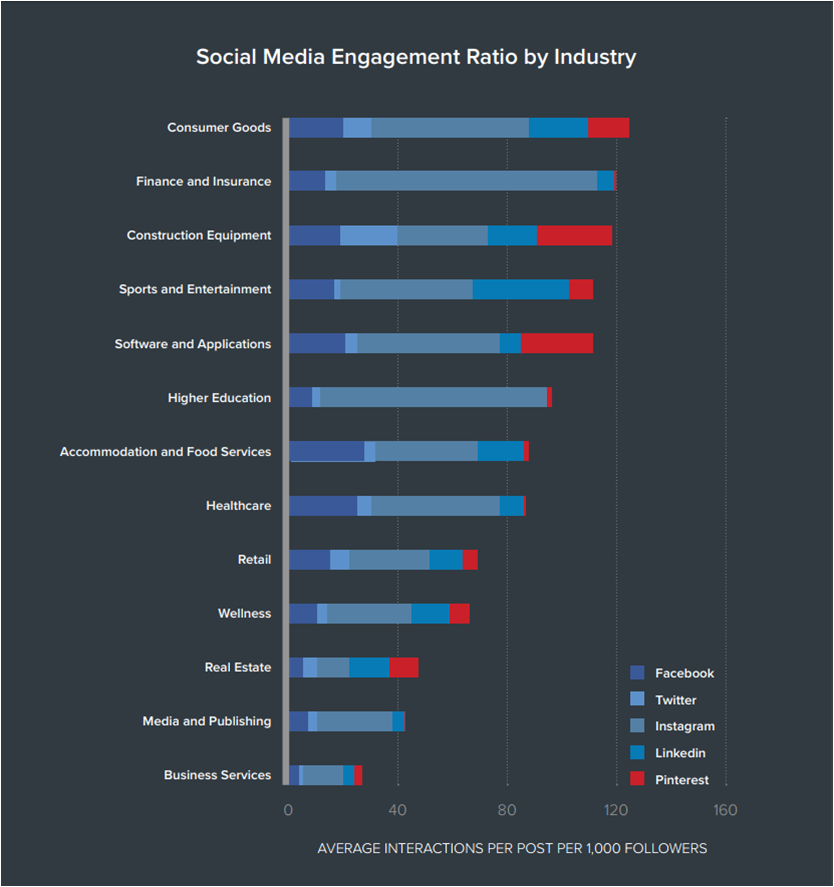
If we look at average interactions per post per 1000 followers, then consumer goods have one of the highest cross-channel engagement ratios. Instagram tops the chart with the most engagement with LinkedIn and Facebook coming in close second.
Interestingly, finance and insurance have the second highest cross-channel engagement ratio, despite the fact that it has a very less online audience as compared to other sectors. This clearly shows that it is not important to have a large audience but to have an engaging audience.
Out of the top 13 sectors, 12 sectors are those which have Instagram as the top engagement channel. This makes Instagram as one of the top channels for digital marketers when it comes to social media. While Facebook also offers quiet decent engagement, Twitter falls flat as it offers very less online engagement for businesses.
Related read: 6 Creative Ways to Promote Your Product on Social Media
Blogging is becoming one of the essential aspects of digital marketing
The importance of blogging has been documented for quite some time. In the current digital sphere, online businesses can leverage upon blogs to engage with consumers on a deeper level and also increase awareness about their brand. Blogging these days revolves making the content go viral. This can be in the form of traditional content blogs or video blogs better known as Vlogs. In fact visual content has far greater impact in digital marketing than traditional content.
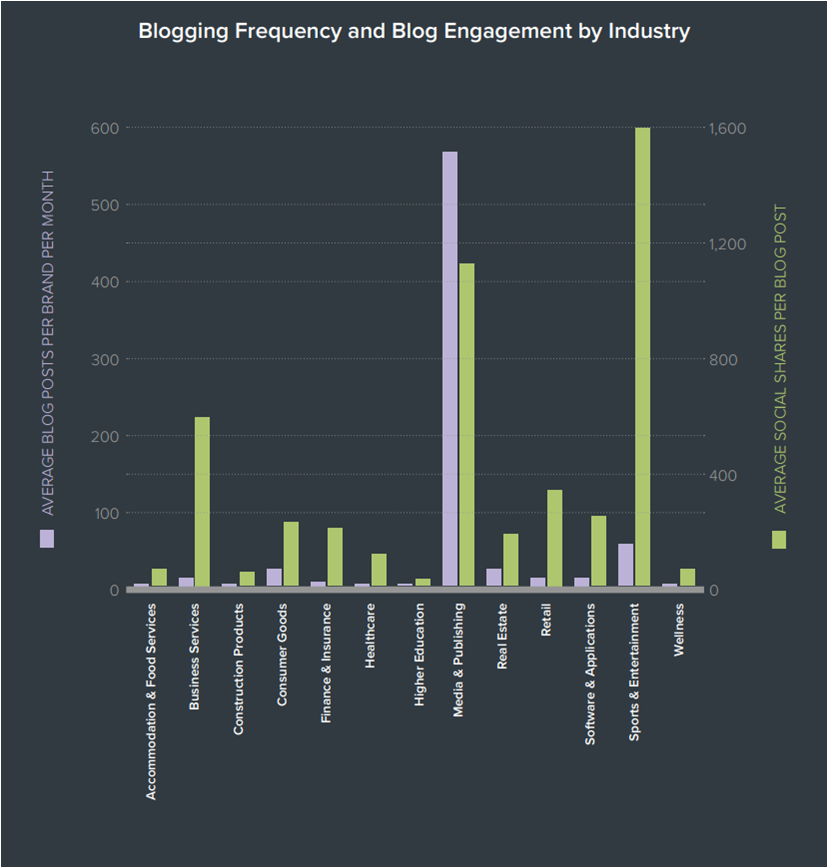
If we look at blogging frequency individually, then obviously media and publishing sector publishes more content than any other sector. In fact, it publishes 10 times more content than Sports and entertainment sector, which comes as a distant second. However, if we look at the engagement of blog being published than sports and entertainment sector has more engagement than media and publishing sector. Every other sector than media and publishing has more social shared per blog posts as compared blogs published than media and publishing.
Looking for a digital marketer that can boost your online presence?
Conclusion
It is crucial for businesses to understand which channels are ideal for them for limiting wastage of resources. If the bulk of your traffic is coming from mobile or social media, there is no sense in investing in organic desktop search. As we enter 2018, mobile and social media will emerge as the top two channels that will shape the digital landscape for businesses and brands. The modern digital marketer must be agile and incorporate latest trends that offer a more targeted approach.
References: All the data mentioned in the post has been extracted from Merkle digital marketing report 2017 and TrackMaven’s digital marketing performance report 2017.


Comments (2)
 Baldev Sharma
 FATbit Chef Post author
Good work, thanks for sharing
You’re welcome!
Keep visiting us for more such knowledgeable stuff.
Cheers!
Team FATbit