There have been numerous reports that state that online travel bookings will continue to grow at a rate of 10% YOY till 2020. For any business sector, this is an impressive growth rate and indicates heaps of opportunities.
But the big question is, “Where exactly do these opportunities exist?”
A business idea has a potential only when you know where the opportunities lie in that particular sector. And to figure that out, you need to study the market at a deeper level to know when, where, & how the customer wants to use your offered services.
To help an online travel booking startup answer these questions, here in this post, we will analyze 5 statistical graphs related to travel industry and draw insights to find out where exactly the opportunities exist in the online travel booking sector.
Graph 1: Online Travel Sales Share by Region (2014-2020)
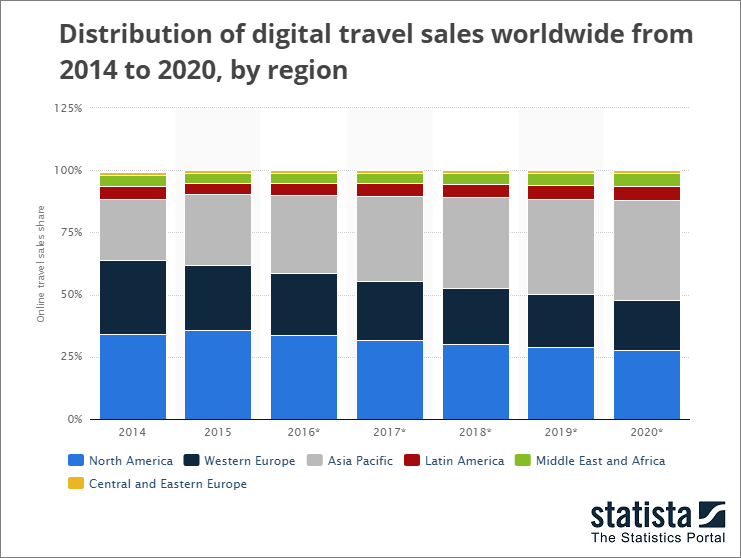
If we talk about the number of online travel sales & revenue generated by them, studies suggest a steady growth worldwide. But if we consider the Asia Pacific region only (primarily India, China, & South-east Asia), the growth will be explosive; as clearly depicted in the graph above.
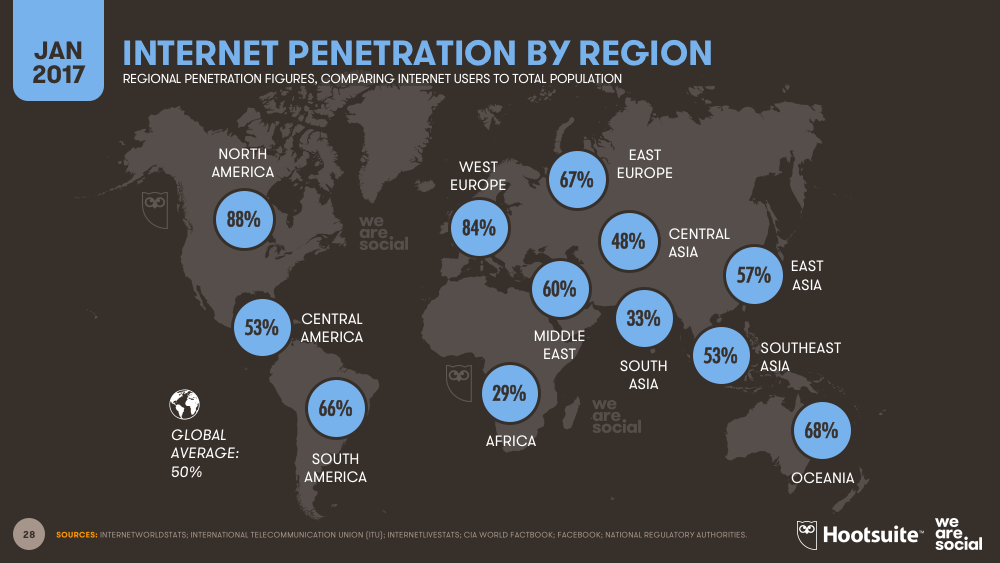
The reason behind this exponential growth is the rapidly growing internet penetration in the region. In North America & Western Europe, internet penetration already sits close to 90%, while in most Asian countries, it is around or less than 50%.
As internet penetration in this region continues to grow and a huge untapped market of online ticket bookers will come to the forefront; making it a goldmine for online booking marketplaces.
Expert Tip: The services that work for North American & European people may not necessarily work for the Asian audience (and for customers of other regions for that matter). So, it is important that you consider making certain changes in the business model (pricing, service offered, etc.) as per the local market.
Suggested Read: Essentials of building an Online Travel Activity Booking Marketplace
Graph 2: Mobile Travel Booking Share in the US (2016-2021)
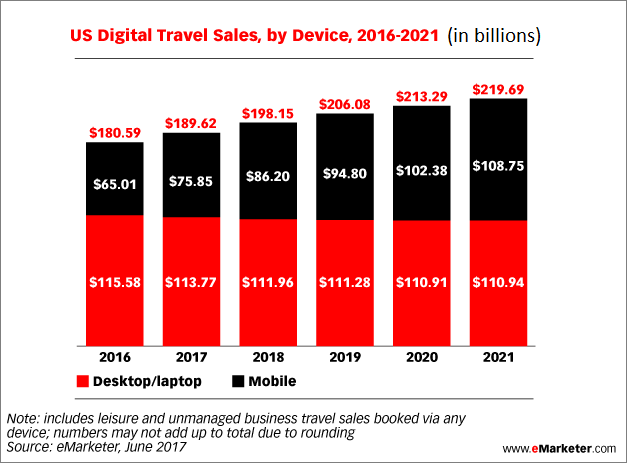
In past few years, mobile has gradually acquired a good portion of desktop/laptop market in every online sector; and online travel booking industry is no exception. We are increasingly relying on our smartphones & tablets for different online chores, and the graph above is a reflection of this observation.
Though the stats are only of the US, it is safe to assume that growth of mobile share in online travel bookings is similar in other markets, if not more. On a more-informed note, in emerging markets like India & China, where internet penetration is primarily driven by mobile internet, the mobile share growth rate would definitely be greater.
In developed markets like North America & Western Europe, mobile travel bookings offer the next growth opportunity for the existing & new players.
Expert Tip: Besides knowing the facts about mobile’s growth, you also need to understand the customer behavior associated with it. Different studies suggest that mobile booking behavior is inclined towards the last minute (same/next day) booking. Also, when considering cross-devices purchases mobile is mostly used as the discovery device.
Build your travel activity booking marketplace with a mobile-friendly platform
Graph 3: Operating System Market Share
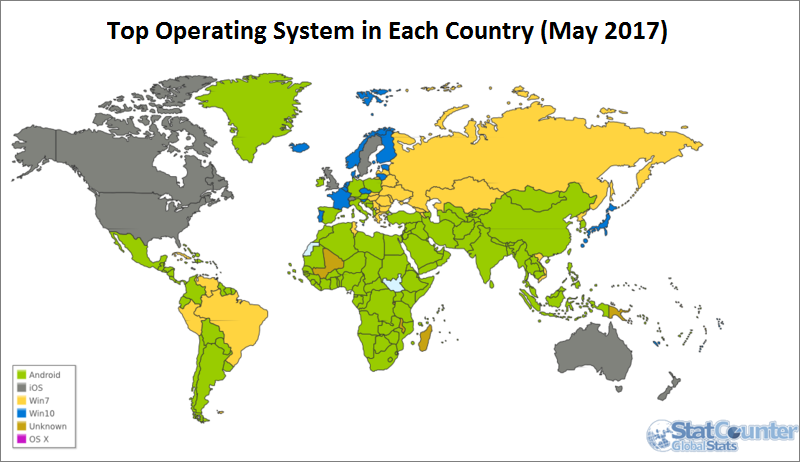
As much as it is important to know the mobile-desktop demographic of your target market, you must also be aware of which operating system most of your target audience might be using.
Even if you are set on a mobile-first approach, you can’t be assured of success until you know out which mobile operating system you need to focus on – Android or iOS. Most startups overlook this factor; consequently, end up allocating their resources poorly. And the result is often a total failure like what happened with this travel booking startup.
This graph gives you the head start on deciding which platform you should focus on the most, depending upon your target market. Also, notice that mobile (Android/iOS) isn’t the most used platform in many markets.
Expert Tip: As mentioned, the graph is just to give you a head-start & to make you pay attention to this crucial factor. To capitalize on it, you need to further research your target market to decide how much you should focus on the desktop, mobile, Android, iOS, Windows, and so on; so that you can allocate your resources smartly to maximize your reach & profit.
Recommended read: Things Entrepreneurs Ought to Know before Planning a Travel Based Startup
Graph 4: Marketing Channels Used by Travel Activity Providers
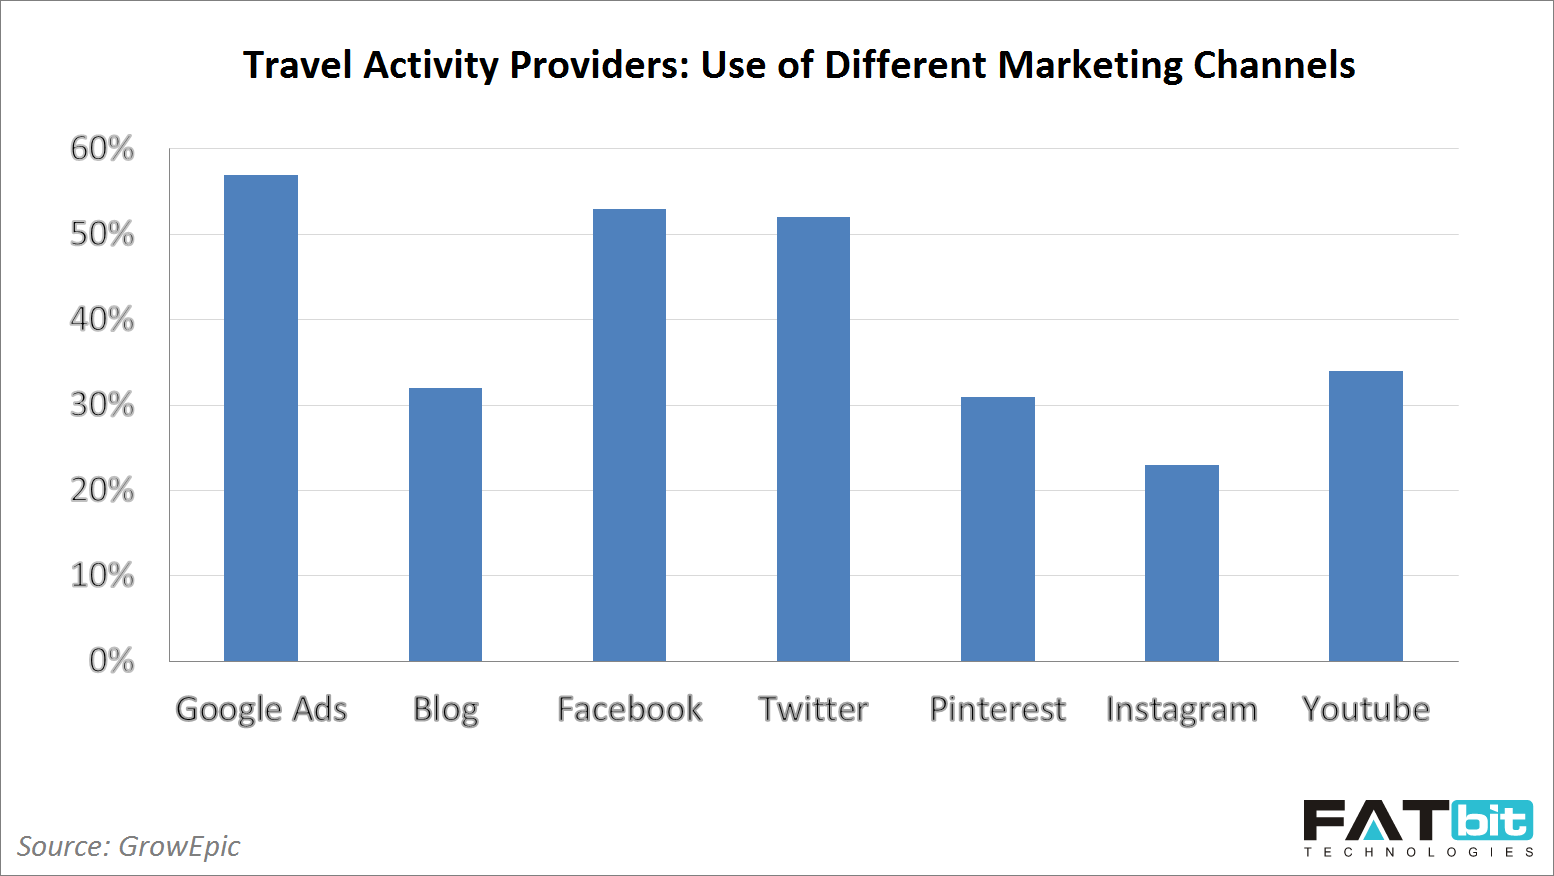
We need not repeat the fact that without online marketing, there will be no existence for your travel activity booking startup. And to ensure that your online marketing campaign works, it is crucial that you know the marketing channels relevant to your business.
With that in mind, the graph above provides a bird’s eye view on which marketing channels are mostly used by travel activity providers.
As an online travel booking marketplace, you will be processing bookings for travel activity providers; so the graph is all the more useful for you. Not only would it assist with better customer targeting, but will also help in connecting with direct activity/service providers.
Expert Tip: In past couple of years, Instagram has proven to be an effective marketing channel for travel businesses. The social media platform is relatively new & marketers have just begun to explore it (which is why its graph is lower than that of Facebook, Google ads, Twitter, etc., which are already being used for a decade). So, it is advised for all travel businesses to make use of Instagram as much as any other popular marketing channel.
Suggested Read: Essentials of Instagram Marketing
Graph 5: Popular Travel Activities
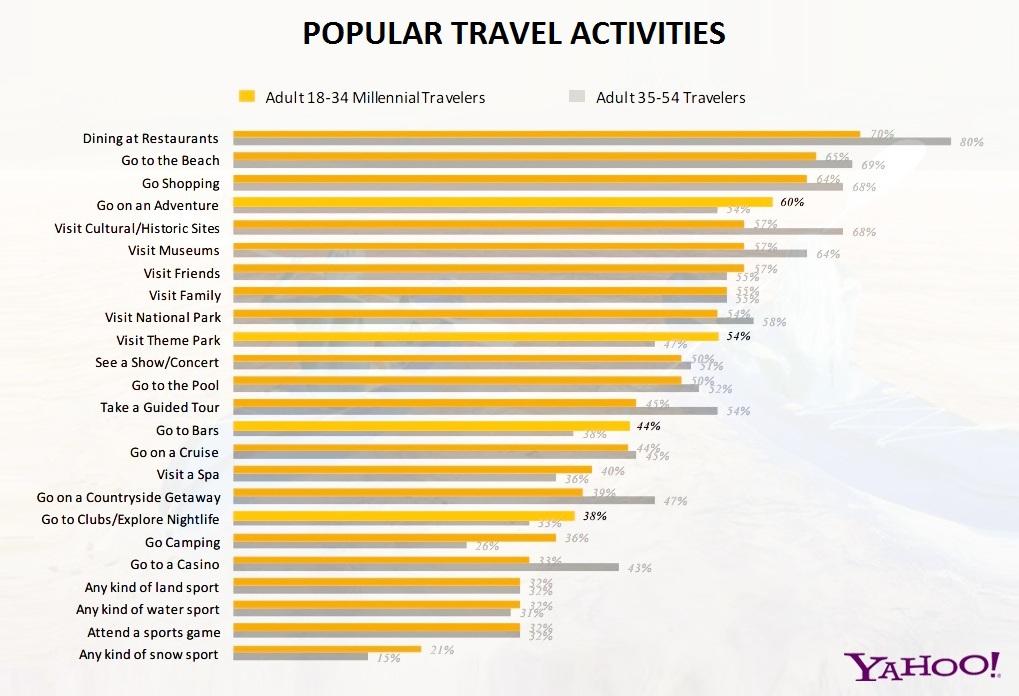
To become the favorite travel activity booking platform among travelers, you need to connect with them on a more granular level. For that, you need to learn which travel related activities they prefer to experience the most.
The graph above shows a comprehensive list of popular activities among the US customers of different age groups; Millennials & mature travelers, to be specific.
Such studies give very clear insights on which activities you should focus on the most when deciding the order and placement of activity categories on your website (navigation, home page, etc.) or in online promotion.So, it is imperative that you analyze the travel activity dynamics of your target market to bring in more and more business.
Expert Tip: Travel activity preferences differ not just by geography, but by seasons. A popular high season activity may not get as many bookings during the off season. Keep that aspect of the market in check as well when you strategize your online marketing campaigns or simply updates on your website.
Related Read: How to Manage Your Travel Activity Booking Marketplace during High Season
Conclusion
Having access to data such as mentioned in the graphs above is necessary to draw the insights crucial for business growth. It helps in understanding the needs & expectations of the end customer, helps in identifying how the existing service system can be made more efficient, as well as in figuring out what new innovative solutions can be brought into to enhance the customer experience further.
Now that you have access to some of this data through this post, it is up to you how you leverage it to take your travel activity business to new heights.
And if you have any questions or doubts about using this data to your advantage, write to us through the comment section below. We will get back to you with the solution.
Leverage the Power of Data with FunAway Travel Activity Marketplace Builder


Comments (2)
 Eve Hunt
 FATbit Chef Post author
Hello to every body, it’s my first pay a visit of this blog; this website consists of amazing and in fact good stuff in favor of readers
Hello Eve,
We are so grateful to you for having said that. Stay tuned for more insights.
Best Regards,
Team FATbit